Data Analyst Program
Collect, clean and visualise data for business decisions using MySQL, Excel Analytics, Python, Tableau and Power BI.
Course Overview
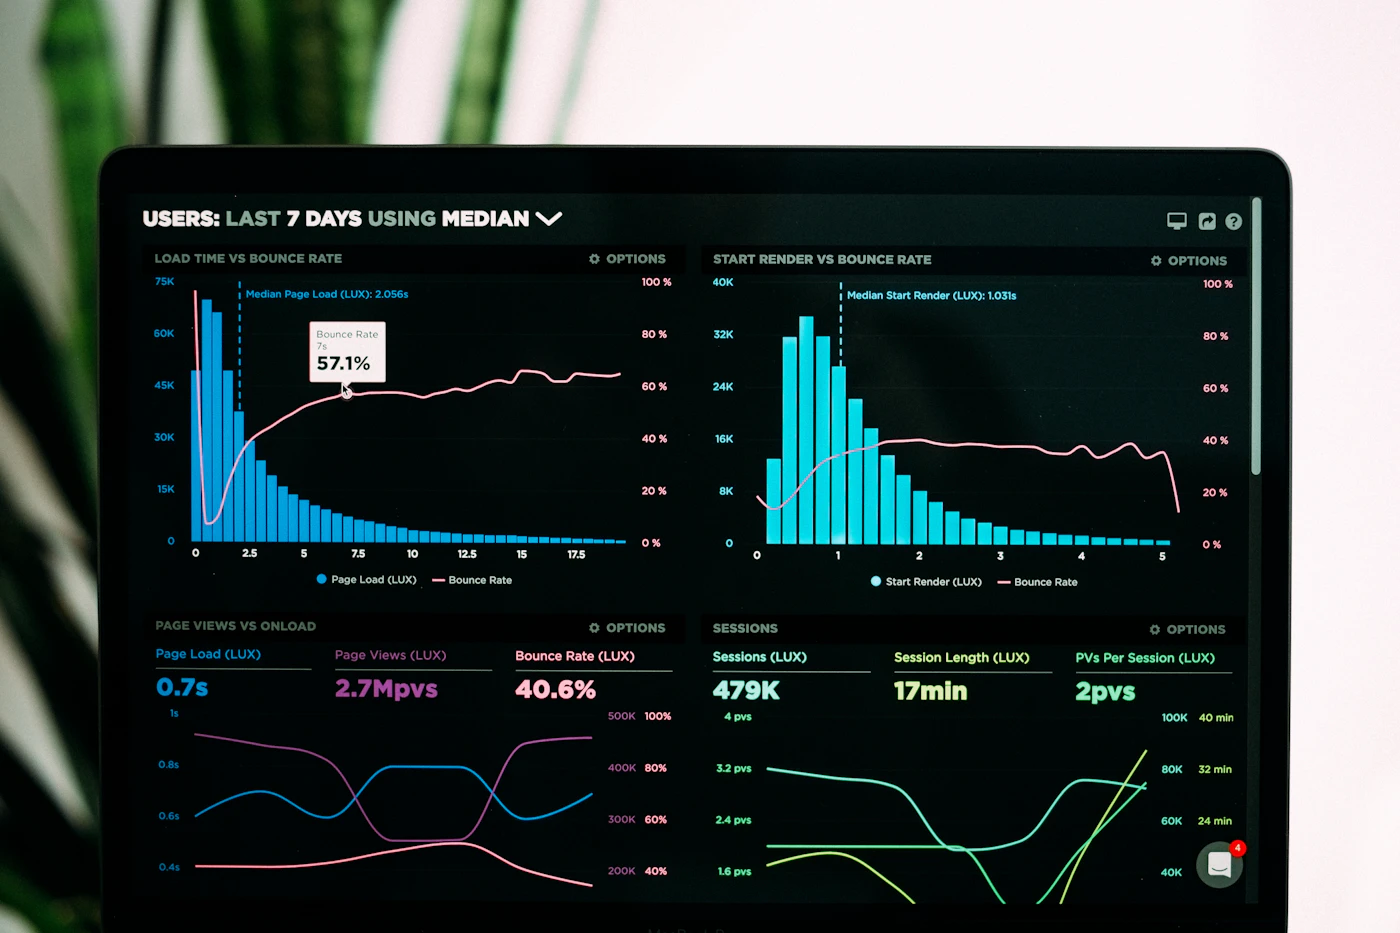
Learn to turn raw data into clear business decisions — from fetching data out of databases to building interactive dashboards.
The program has five modules — MySQL, Excel Analytics, Python Programming, Tableau and Power BI.
What You'll Learn
- Design databases and write complex queries in MySQL
- Excel analytics — functions, pivot tables, charts and dashboards
- Python programming, database integration and web scraping
- Visualisation with Matplotlib and Seaborn
- Interactive dashboards in Tableau
- Power BI reports with Power Query and DAX
Curriculum
- Installation & Configuration
- Using Tool – MySQL Workbench
- Design Database / Constraints
- Indexes / CRUD Operations
- Select Queries / Functions
- Groups / Joins / Views & Inline Views
- Subqueries / Complex Queries
- Creating Professional ER Diagrams
- Working with Spreadsheets
- Preparing Manual Data
- Fetching Data from Database
- Excel Common Functions
- Pivot Tables
- Charts
- Project on Dashboards
- Data Visualization
- Programming Basics
- Functions / OOPs Programming
- Exception Handling
- MySQL Server Setup
- Database Integration with Python
- Web Scraping
- Matplotlib & Seaborn – Visualization
- Tableau Interface
- Date Aggregations and Date Parts
- Data Visualization & Formatting
- Run Time Columns
- Advanced Functionalities
- Filters / Advanced Charts
- Dashboards
- Power BI Introduction
- Power Query
- Creating Power BI Reports
- Report Visualisation & Properties
- Charts & Maps Report Properties
- DAX Expressions
- Visualization & Dashboard
Tools & Technologies
MySQLExcelPivot TablesPythonMatplotlibSeabornTableauPower BIPower QueryDAX
Career Outcomes
Data Analyst
Business Analyst
Reporting Analyst
MIS Executive
Who This Course Is For
- Eligibility: 12th Pass / Appeared
- Commerce, science or arts graduates seeking an analytics role
- Office and MIS professionals who want stronger data skills
- Anyone who enjoys spreadsheets and wants to go further with BI tools
Course FAQs
This course is focused on analytics and business intelligence — dashboards, reporting and decision support. The Data Science track goes deeper into machine learning and deep learning.
No. Python here is used only for practical data tasks and is taught from scratch. Most of the course is Excel, SQL and BI tools.
Both are widely used by employers, so we teach both. You will be comfortable building dashboards in either.
Keep Exploring
Related Courses
ICDS
Data Science & AI
Data Science Program
MySQL, Tableau, Python, machine learning and data structures & algorithms.
View course detailsICMT
Office & Accounting
MS-Office & Tally Programs
MS Office, Advance Excel, Tally accounting and GST for office and accounts jobs.
View course detailsICDM
Digital Marketing
Digital Marketing & Advertising
SEO, Google Ads, social media marketing and lead generation for real campaigns.
View course details
Ready to Start?
Enquire About Data Analyst
Send your details and our admissions team will call you back within 24 hours with the syllabus, fees and next batch dates.